Ihsan Wanda
Analytics Engineer · Data Platform Architect
I build the layer that makes a data platform answer questions in its own language — semantic models, validated metric definitions, and self-documenting warehouses. Underneath that, I ship end-to-end dbt pipelines, and daily I reconcile messy commercial data until the numbers stop lying.
The habit underneath all of it: don't trust a number you can't re-derive. A metric tree that rejected 6 of 135 proposed definitions. An agent that refuses any value it can't prove at the cited row. An audit of my own work that found the scoring tool I'd written was returning mock data — so I removed it rather than publish it. I've spent this year learning to apply that one rule to data, to agents, and to my own output.
A note on the numbers on this page. Every figure below comes from a file I can point you to — a test manifest, a run log, a validation report. Where something failed or is still open, I say so rather than rounding it away. That habit is the same one that shapes the work.
01Platform architecture
The hardest problem in analytics isn't storage or compute. It's that nobody can say what the numbers mean — so every question routes through one person, and every metric is re-derived from scratch.
I built a semantic layer over a production platform: 118 tables and
65 pipelines distilled into a 35-concept graph (70 typed relations)
and a 135-metric business tree, then compiled into a single offline HTML file that
opens from file:// with no server and no runtime dependencies.
machine-derived · regenerable human-owned · not regenerable compiled output
-
1 · Mechanical schema
One file per table: columns, types, engine, producing pipeline, lineage. No interpretation. Fully regenerable — delete and rebuild, identical result. Covers all 118 tables, including the ones nobody remembers existing.
-
2 · Business meaning
Per table, in plain language: what it is for, who depends on it, what "correct" means here, what breaks downstream. Not automatable — authored with domain knowledge, reviewed by the data owner.
-
3 · Concept graph
35 business concepts, 70 typed relations. Maps concept → table → producing pipeline, so the question gets answered in business language rather than table names.
-
4 · Business metric tree
135 metrics across L0–L3. Each carries definition, unit, grain, direction of goodness, and a pointer to the SQL behind it — and is validated before it is trusted.
-
5 · Retrieval memory & glossary
Per-concept notes for an assistant to read, plus a 24-term bilingual glossary — a metric name that means two things in two languages is a defect waiting to happen.
-
One offline HTML file
Everything above compiles into a single artefact that opens from
file://— no server, no network, no runtime dependencies. It cannot break, cannot phone home, and cannot be blocked by a firewall.
The machine may propose; the domain owner disposes. Every AI-authored artifact is validated against source before it's trusted, and an owner can reject it. Of 135 proposed metrics, 128 were approved, 6 failed validation, and 1 was rejected by its owner — a metric tree with a 100% approval rate would mean nobody was checking.
Verified from the repository's validation report · owner decisions recorded separately and always take precedence
02Analytics engineering, end to end
Two public pipelines, both live, both with CI enforcing every test.
palm-analytics-dbt
Four keyless data sources → a Kimball star schema across 23 models
(staging → intermediate → marts), with SCD2 snapshots,
model contracts, custom macros, and 99 passing tests in CI. It serves an
interactive dashboard where an estate manager decides the day's operations.
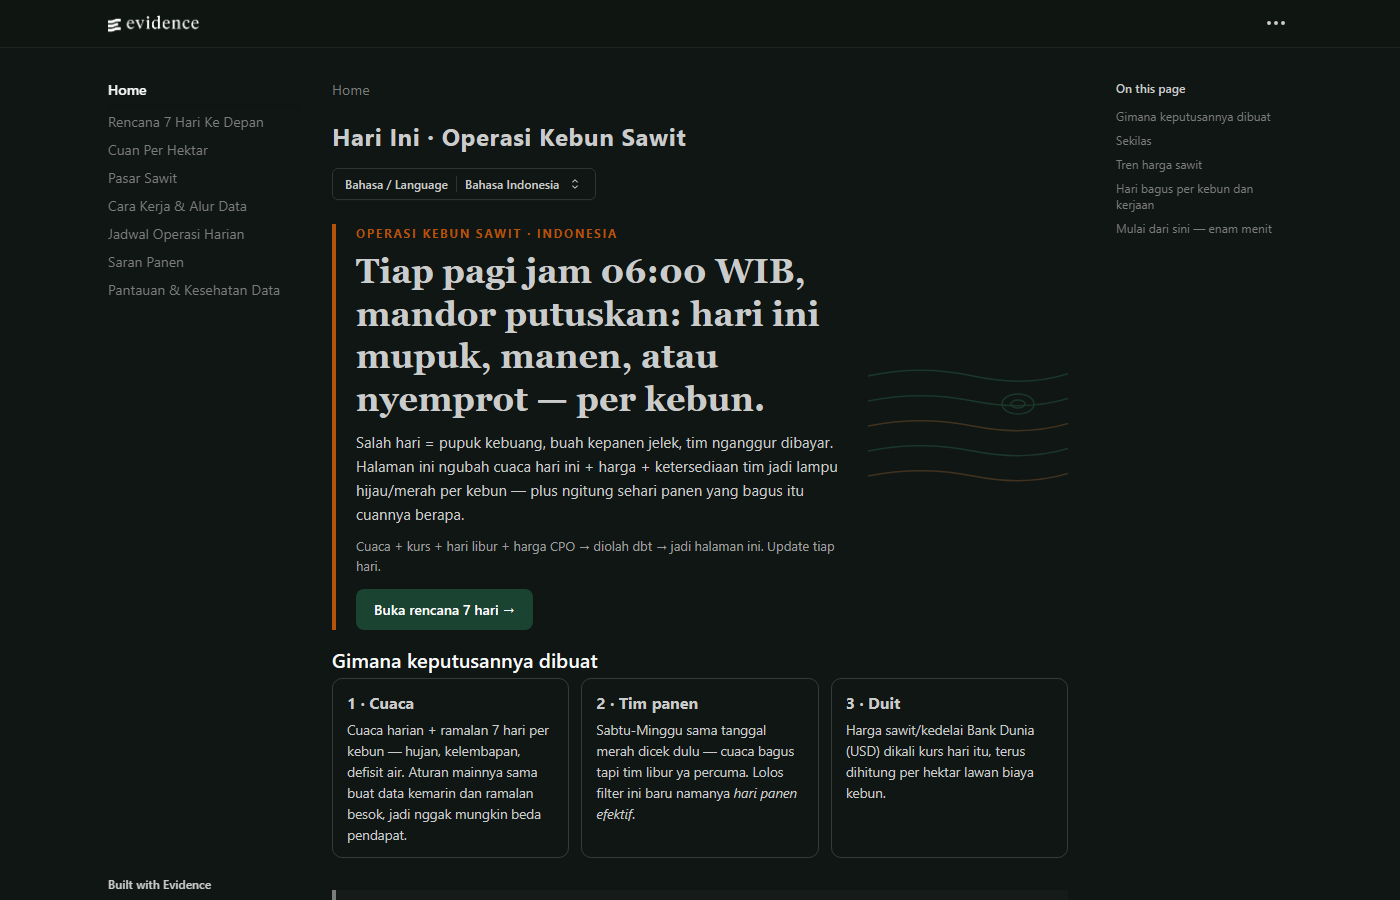
99 of 99 tests pass in CI · all four sources are public and keyless
developer-marketing-measurement-dbt
Marketing measurement where ad platforms over-claim conversions by hundreds of percent. Attribution triangulation: Multi-Touch Attribution + Media Mix Modeling (adstock & Hill saturation) + incrementality testing (geo-lift, holdouts), reconciled into one tested semantic layer. 15 models, 19 passing tests.
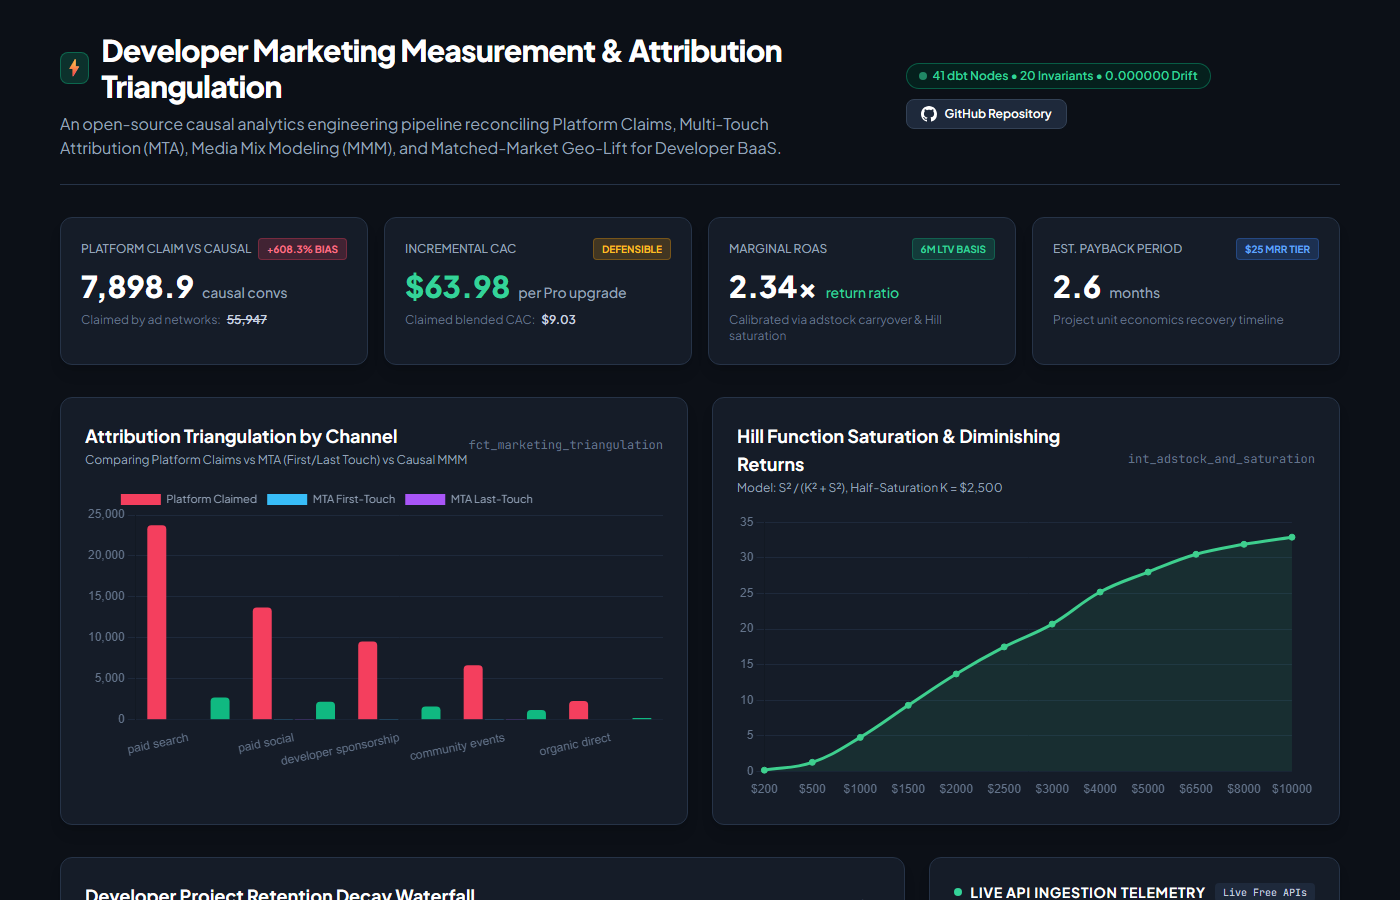
19 of 19 tests pass · campaign and PLG telemetry is synthetic; the modelling layer is real
03Messy business problems, daily
Most real analytics work is not greenfield. It's three systems that disagree, and a number somebody trusts.
CRM sales reconciliation — a manual process, rebuilt as a verifiable pipeline
Replaced a team's manual reconciliation with a pipeline that unified three separate systems, matching 18,537 orders (98.5%). Doing so surfaced defects the manual process had been silently absorbing:
| Defect surfaced | Scale | Status |
|---|---|---|
| Records double-counted across two systems | 12 records, 0.06% overstatement | fixed |
| Partially-paid records counted at full value | 2.1% overstatement | fixed |
| Cancelled records with payment retained | 87 records | escalated |
| Shipping counted as revenue | 926 records | escalated |
| A "trusted" headline figure that moved 92% in one day | flagship metric | escalated |
Each defect ships with a runnable verification query, so any claim can be re-tested instead of taken on trust. The point of the migration wasn't saving hours — it was that the numbers became verifiable.
Match rate measured on the reconciliation run · 4 of 5 defect classes were still open with the owning team as of Oct 2026
04One challenge, five projects
Late 2025 I entered a computer-use agent challenge and kept going after the submission. Each project answered the question the previous one raised — and one of them ended with me deleting my own work.
- ColdStart — Do agents generalize, or just repeat what they were tuned on? Built an unseen-environment factory. 0% on structural change.
- Slop-Catcher — Tried to score design quality automatically. I audited my own tool and found the scores were fabricated by a mock client — so I removed it instead of publishing it.
- nakama QA — Took the rigour to someone else's live codebase. 8 merged fixes on a 2,298-commit project I don't own.
- arc-cua — Built the harness that could actually measure — and this time the numbers are real.
- arc-index — Extended it to documents: extract each field with a citation, refuse any value it can't prove.
The Slop-Catcher is the one I removed. It shipped no result, and that's the point — a benchmark that cannot fail is worse than no benchmark.
ColdStart — a zero-shot generalization benchmark for computer-use agents
Standard agent evaluations only test repeatability on screens the agent was already tuned on. ColdStart turns VM snapshots into an unseen-environment factory: it procedurally mutates a working app along five axes and measures whether an agent still works on a version it has never seen. Verification is fail-closed — expected state is recomputed from the seed and bound by hash, so a screenshot can't fake a pass.
| Robustness by perturbation axis | Success | Reading |
|---|---|---|
| P5 · Theme and visual restyling | 100% | holds |
| P3 · Field ordering | 50% | partial |
| P2 · Structural change | 0% | breaks first |
6 live runs, 2 per variant. The useful result is the negative one: the agent survives cosmetic change and fails on structural change, which is the limit worth knowing before deploying one.
110 of 110 unit tests pass · MIT licensed · built on a fork of Solari's cookbook, with ColdStart added by me · small sample, so read the direction rather than the percentages
arc-cua — browser harness & grounded document extraction
An agent sees a page as a token-budgeted accessibility tree with [#N] action
indices, and acts through verified actions. Built on it, ARC Index extracts
each field from a document with an evidence quote and citation, and refuses any value
it cannot prove at the cited row — then batch-fills the form and returns an audit
receipt.
| Measured on live cloud browsers | Baseline | This work |
|---|---|---|
| Task success, same model head-to-head | 21 / 24 | 24 / 24 |
| Input tokens across 24 runs | 458,546 | 122,034 · 3.8× fewer |
| Input tokens per document appeal | 26,955 | 1,209 · 22× fewer |
| Cost per appeal | $0.02575 | $0.00305 · 8.4× cheaper |
| Wall time per appeal | 89 s | 11.4 s · 7.8× faster |
| Wrong values let through, of 60 fields | 0 | 0 · equal accuracy |
Same model on both sides. Raw per-run JSON is committed, and the measurement method is written up in the repository.
Runs recorded 2026-09-27 / 09-29 · token counts estimated from characters on both sides, so the comparison holds
05How I work with AI
Not autopilot — I build the contracts that make it safe, and the reasoning lives in the repo.
- 8 repos carry machine-readable operating contracts (
CLAUDE.md/AGENTS.md) specifying commands, authority, and production risk — including which target writes to real production, and which source wins when two disagree. - 15 ADRs in the commercial ETL record why a decision was made, not just what was built.
- Validators with teeth: every AI-authored artifact is checked against source before it's trusted, and a human owner can reject it.
- Measured post-mortems encoded as rules — a working agreement written because one avoidable mistake cost three hours, with the hours recorded.
- AI co-authorship is disclosed in git history, not hidden.
The through-line: ungrounded output shouldn't be trusted — in analytics that's a metric with no source, in agent systems a form field with no evidence, and in research a benchmark that can't fail. The metric tree rejects unsupported definitions, arc-index refuses unproven values, and the Slop-Catcher was deleted once I found it returning mock scores. Same rule each time: propose, validate, let a human dispose — and throw it away if it can't survive that.
06How I got here
One method, applied three times: learn by building, let real users correct you, then erase the bottleneck you just found.
From industrial engineering → data → agentic AI
I started in industrial engineering, where the job was never to theorize — it was to build something, watch it fail under real conditions, and fix the flow. That's how I moved into data analytics about six years ago, and it's the same reason I'm moving into AI now.
My first AI-assisted build was a team donation app. The problem was ordinary and I'd seen it repeat: contributions announced in a chat group, transfer screenshots scattered across private threads, one person manually reconciling the mess before every deadline. The transparency was fine — what was missing was a clear flow. I volunteered to build it, shipped it, then ran it against real colleagues: ask for feedback, watch where the flow breaks, ship again.
That loop taught me more than any course, and it also exposed my own gap — I was copying code into a chat and pasting it back without understanding Git or CI/CD. So I rebuilt the loop around agentic coding, which let me read a pipeline instead of guessing at it. The projects above are the result of that shift.
129 of 129 tests pass · Supabase + Cloudflare Pages · donor sign-up, equal-split or custom amounts, combined payments, receipt upload, PIC verification, refunds on overshoot
07Also
- proofscout — trust-bound market-intelligence scanner: fail-closed approvals, immutable evidence, offline test suite. Repository
- orakuru-bonding-curve-analytics — on-chain bonding-curve suite (dbt/DuckDB, Dune V2). Proof page · Repository
- analytics-architecture-decisions — ADRs on warehouse cost-optimization and materialization. Repository
- Contributed 8 merged fixes to upstream nakama.